-

Administrator Guide
-
Collect Logs
-
Collect Logs: Apps & Services
- ESXi
- Routers network hardware
- Apple iOS and macOS
- Unix and BSD system logs
- C# and .NET (NLog)
- C# and .NET (log4net)
- Java logback
- Android
- Kubernetes cluster logging with rKubelog
- haproxy
- Advanced Unix logging tips
- Perl
- Windows
- Kubernetes
- Erlang
- Node.js
- Java log4j
- JavaScript
- Unicorn
- PHP
- Docker
- systemd
- Ruby on Rails
- MySQL
- Unix and BSD text log files (remote_syslog2)
- Redis
- Go
- Python
- Elixir
- IIS
- Embedded devices or proprietary systems
-
Collect Logs: Hosting Services
-
Collect Logs: Integrations
-
Manage Logs
- Groups
- Log flood detection
- Web Hooks
- Log colorization
- Linking to logs
- JSON search syntax
- Settings API
- Log destinations
- Alerts
- Command-line client
- Log filtering
- HTTP API
- Automatic S3 archive export
- Managing Senders
- Permanent log archives
- Mapping senders to groups
- Search syntax
- Click-to-search
- Log search API
- Event Viewer
-
Send Logs for Analytics
-
SolarWinds Users & Orgs
-
Support and Security
-
What's New
Log colorization
How to enable colorization and how to customize with different colors, colorize certain programs or apps, and more.
Contents
- Standard colors
- Customize colors to highlight different systems, programs, and errors
- Viewer customizations
Standard colors
Papertrail can automatically colorize the system and program name links in the Web log viewer, like this:
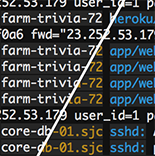
Enable it in your profile.
To colorize text within log messages, generate messages containing ANSI escape codes. Papertrail will colorize them as shown in More colorful logging with ANSI color codes. Papertrail colorizes normal foreground colors, which are ANSI 30 to 37 (see this table for a visual example). Codes in either direction (ex: behaviors, lighter variants) are not supported and may not render properly. Papertrail honors ANSI color codes regardless of user-specific colorization preferences.
With colorized logs, the event viewer looks like this:
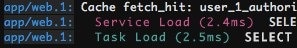
Even though color codes aren’t visible, they can still affect search results. In particular, it’s not possible to search for a phrase that crosses a color boundary. In the screenshot above, a query for "Task Load (2.5ms)" would match, but "(2.5ms) SELECT" would not.
If you need to filter colorized logs, check out the example regex.
You can also customize almost any aspect of the log viewer. Read on for how to colorize a specific program or system, change text size, or use completely custom colors and options.
Command-line client
Colorization for the papertrail command-line app is part of the papertrail-cli README.
Customize colors
Background
Our goal is always to expose the right level of customization and in the correct form, and not just create options for the sake of creating options. A more complex product, or even a more sophisticated one, is not always a better one.
With colorization, there’s a slippery slope between a bit of color to add contrast and enhance readability, and an end-to-end custom theme markup. Those aren’t likely to let you do more with your logs, especially compared to other ways which that time (ours and yours) could be invested.
However, you might have different design taste than we do, have a specific vision in mind, or just want to tinker. If you already use a browser extension to customize site design or behavior, the customization examples below offer some ideas.
Examples
Colorize certain programs or systems
Make the program mysqld orange:
.event-list .event[data-program="mysqld"] .program { color: #cb4b16 !important; }Make any system names containing db red:
.event-list .event[data-system*="db"] .system { color: red !important; }Note the *= instead of = to match substrings within the system name, rather than = for exact match. These are standard CSS attribute selectors. Any selector can be used.
Instead of changing the color of the system name, here’s how to make the entire message text red on dark red (for messages from systems containing db):
.event-list .event[data-system*="db"] .message { color: red !important; background-color: darkred !important; }Colorize based on message contents
The same technique can be applied to the data-message attribute instead of the data-system attribute. This will colorize any messages containing “OMG” dark red.
.event-list .event[data-message*="OMG"] .message { color: red !important; background-color: darkred !important; }Colorize based on severity
Highlight messages based on their severity using the data-severity attribute:
.event-list .event[data-severity="Warning"] .message { color: LightSalmon !important; }
.event-list .event[data-severity="Error"] .message { color: Red !important; }
.event-list .event[data-severity="Info"] .message { color: White !important; }
.event-list .event[data-severity="Debug"] .message { color: Cyan !important; }
Change text size
Reduce the log viewer display size with:
.event-list .event { font-size: 10px !important; }Reduce the search box size with:
#ftr #search input.text { font-size: 12px !important; }Override all colors
The log message has four CSS elements: timestamp, system name, program name, and message text. Override any or all of them.
Here’s an example that overrides all four message elements for a distinctly The Matrix look:
.event-list .event time { color: darkgreen !important; }
.event-list .event .system { color: #3a6b49 !important; }
.event-list .event .program { color: #8ba786 !important; }
.event-list .event .message { color: green !important; }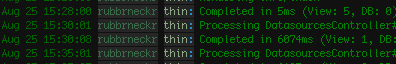
Or a very bright theme:
.event-list .event time { color: #cdee46 !important; }
.event-list .event .system { color: #26d51c !important; }
.event-list .event .program { color: #f143cc !important; }
.event-list .event .message { color: #3064f7 !important; }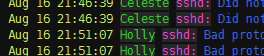
We don’t change these tags often, so they are reliable for use in your CSS.
If you create CSS that others might use, or you have comments or requests, contact us.
Viewer customizations
Hide leftmost timestamps
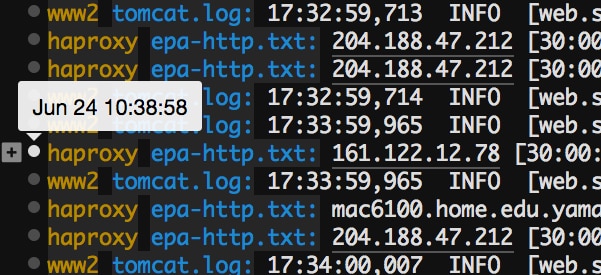
If all senders include their own timestamps in each log message, Papertrail’s timestamps can be hidden using the viewer option Hide Time:
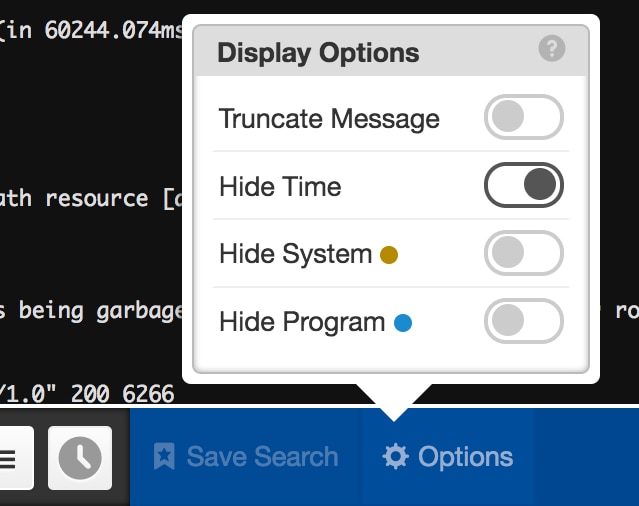
which contracts the timestamp to a dot on the left side of the screen. Hover over the dot to display the time in a tooltip:
Credits
Thanks to Sam Stokes, Rapportive, Luke Carpenter, and Ghostworks for major contributions to this. Y’all rock.
The scripts are not supported under any SolarWinds support program or service. The scripts are provided AS IS without warranty of any kind. SolarWinds further disclaims all warranties including, without limitation, any implied warranties of merchantability or of fitness for a particular purpose. The risk arising out of the use or performance of the scripts and documentation stays with you. In no event shall SolarWinds or anyone else involved in the creation, production, or delivery of the scripts be liable for any damages whatsoever (including, without limitation, damages for loss of business profits, business interruption, loss of business information, or other pecuniary loss) arising out of the use of or inability to use the scripts or documentation.