-

Administrator Guide
-
Collect Logs
-
Collect Logs: Apps & Services
- ESXi
- Routers network hardware
- Apple iOS and macOS
- Unix and BSD system logs
- C# and .NET (NLog)
- C# and .NET (log4net)
- Java logback
- Android
- Kubernetes cluster logging with rKubelog
- haproxy
- Advanced Unix logging tips
- Perl
- Windows
- Kubernetes
- Erlang
- Node.js
- Java log4j
- JavaScript
- Unicorn
- PHP
- Docker
- systemd
- Ruby on Rails
- MySQL
- Unix and BSD text log files (remote_syslog2)
- Redis
- Go
- Python
- Elixir
- IIS
- Embedded devices or proprietary systems
-
Collect Logs: Hosting Services
-
Collect Logs: Integrations
-
Manage Logs
- Groups
- Log flood detection
- Web Hooks
- Log colorization
- Linking to logs
- JSON search syntax
- Settings API
- Log destinations
- Alerts
- Command-line client
- Log filtering
- HTTP API
- Automatic S3 archive export
- Managing Senders
- Permanent log archives
- Mapping senders to groups
- Search syntax
- Click-to-search
- Log search API
- Event Viewer
-
Send Logs for Analytics
-
SolarWinds Users & Orgs
-
Support and Security
-
What's New
Event Viewer
Introduction
The event viewer, also called the log viewer, is a core part of Papertrail.
Elements
- Tail live logs
- Search logs
- Save searches and create alerts
- Log velocity graph
- Seek to a time or date
- Show related context
- Navigate the viewer
- Customize the viewer
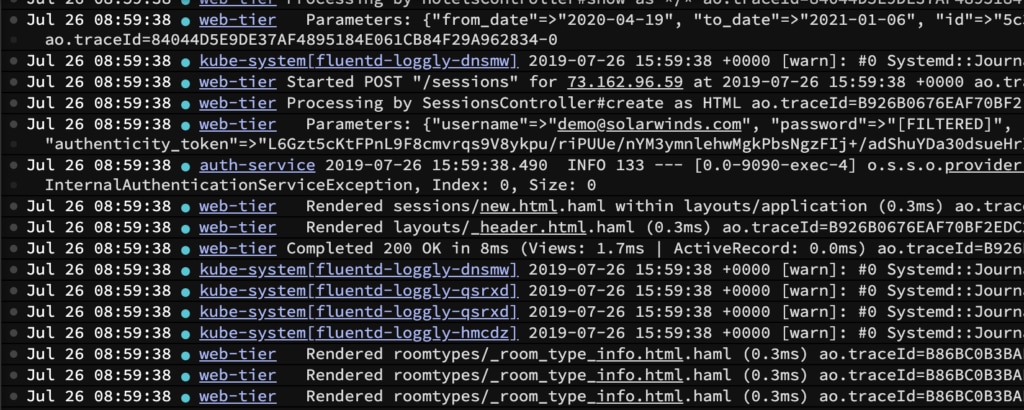
Screenshot
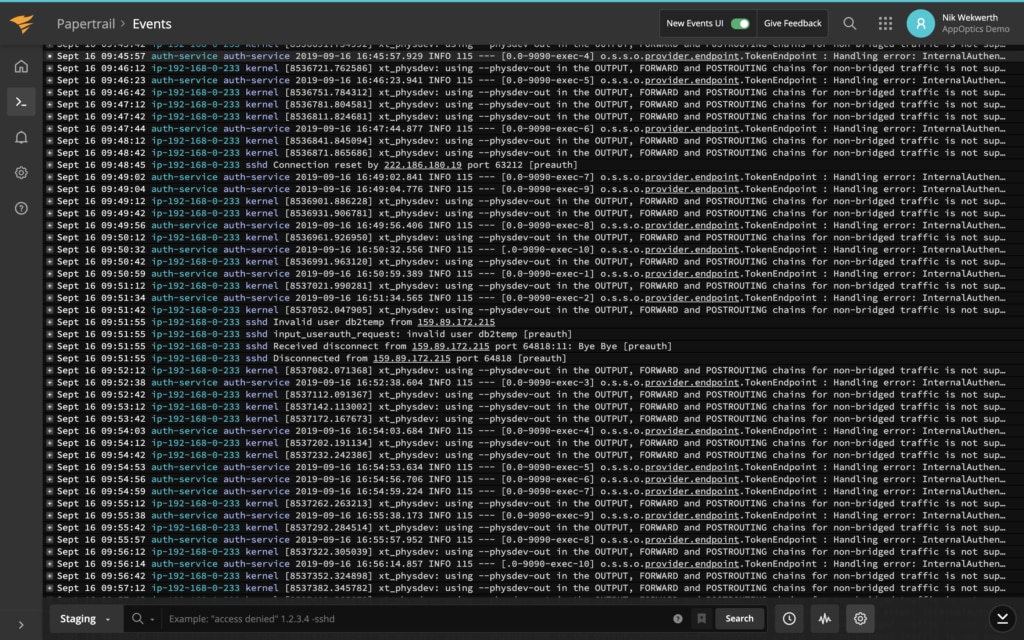
Live tail
When you arrive in the log viewer, Papertrail is showing events as they happen. It’s realtime, as if you were logged directly into a system (or hundreds of systems). Logs are live.
Pause logs
To pause live logs, scroll up or click PAUSE:
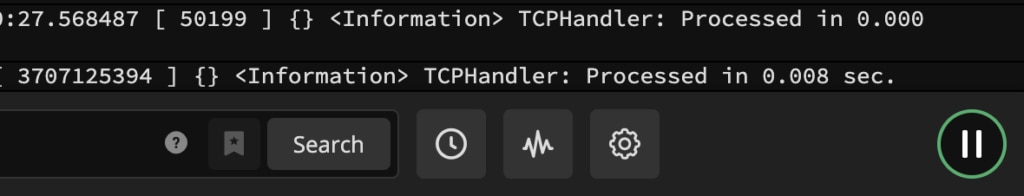
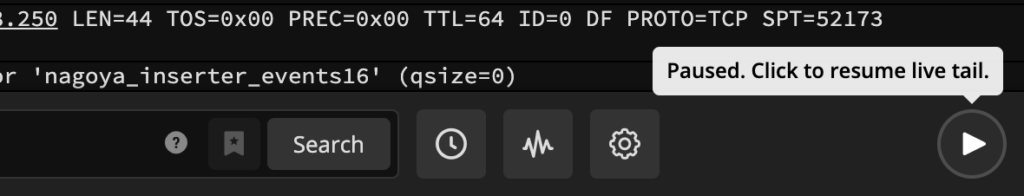
Resume live tail
When paused on current logs, click LIVE to resume live tail:
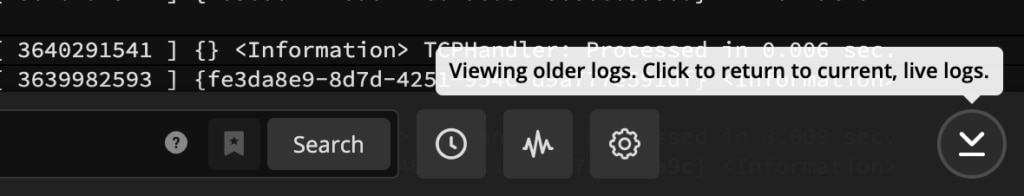
Return to current and resume live tail
When viewing older logs, click the down arrow or scroll down to return to current logs and resume live tail.
Search
Search is integrated into Papertrail’s event viewer:
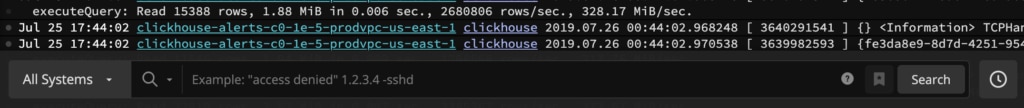
Find anything just by typing what you know. If you’ve used Google search, Papertrail search works much the same way, including phrases ("), logical operators (AND, OR), and exclusion (-).
Click ? just to the left of the Search button to see example searches without leaving the log viewer, or read about the syntax.
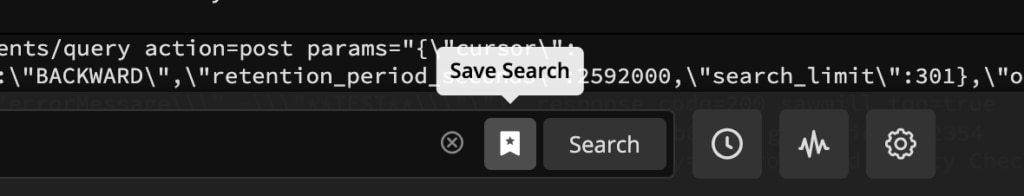
Save searches and create alerts
As your team uses Papertrail more, some searches will probably be worth accessing again, receiving in email, graphing, or otherwise retaining.
After entering a search query, click Save Search to retain the query:
Give it a name, and optionally set up a search alert right away:
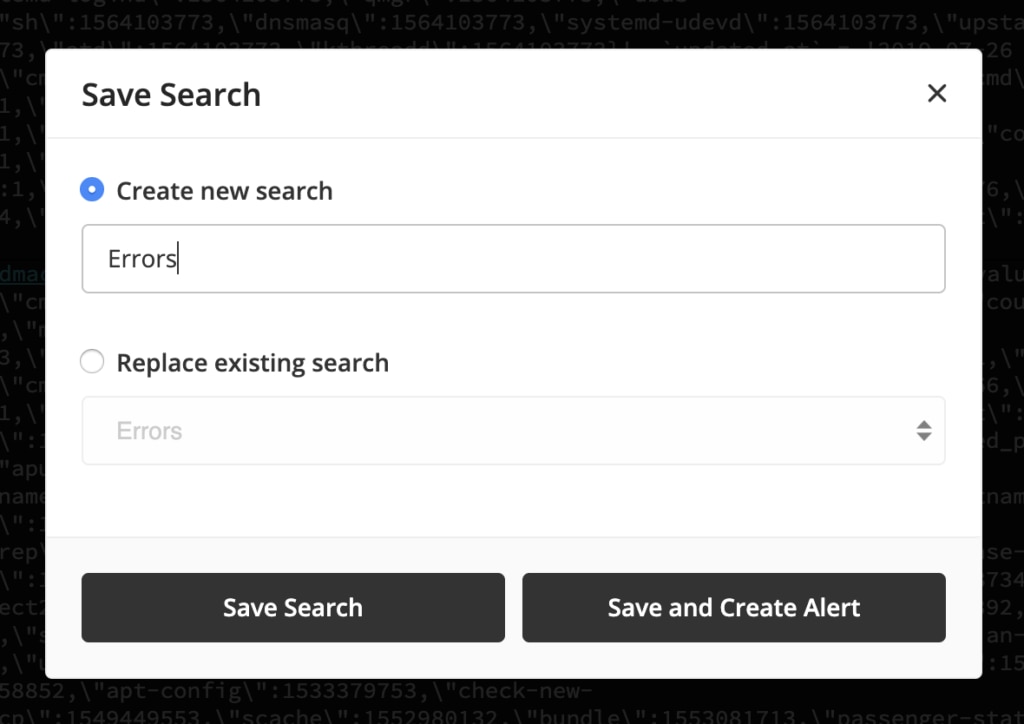
Alerts can also be added later.
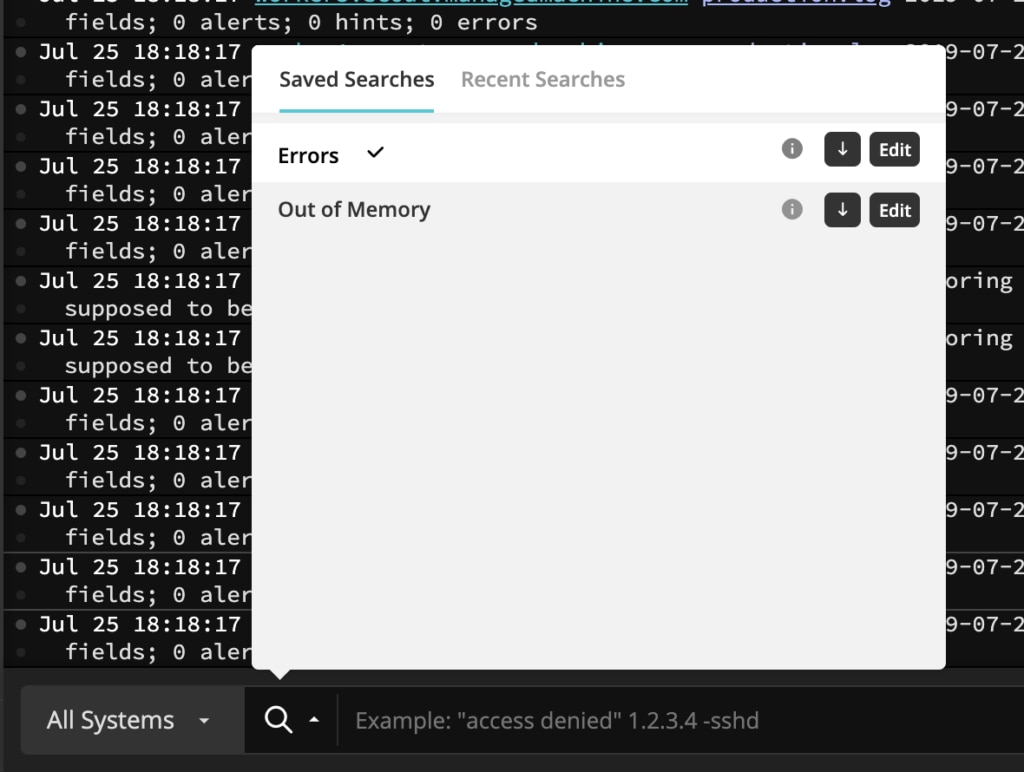
The saved search will be shown on the team-wide Papertrail Dashboard, like these:
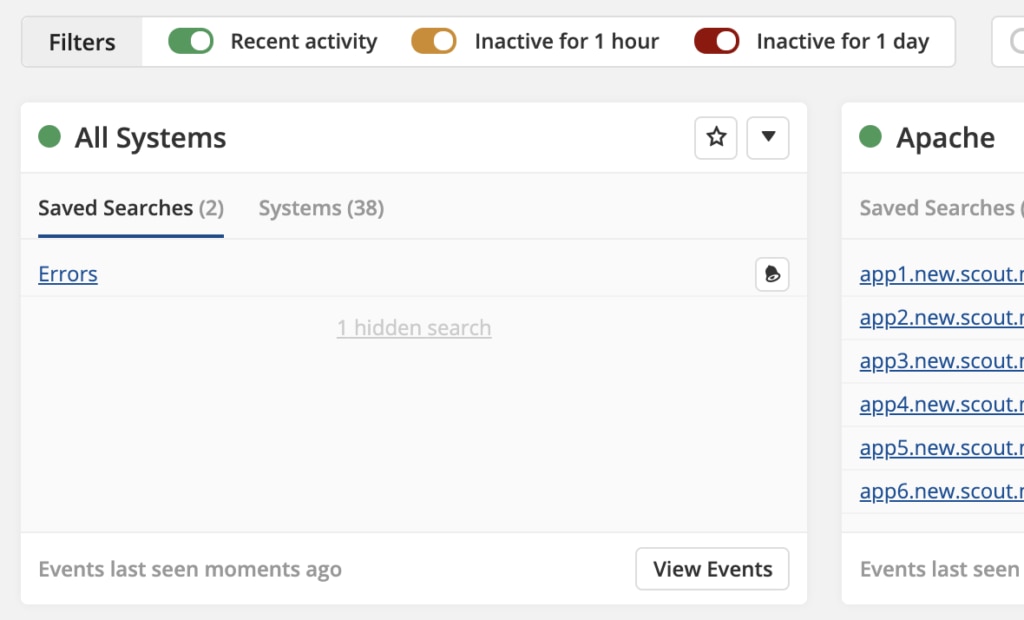
and will be accessible from the event viewer’s Saved Searches button:
Log velocity graph
When viewing or searching logs, click the graph button to see patterns in the number of messages:
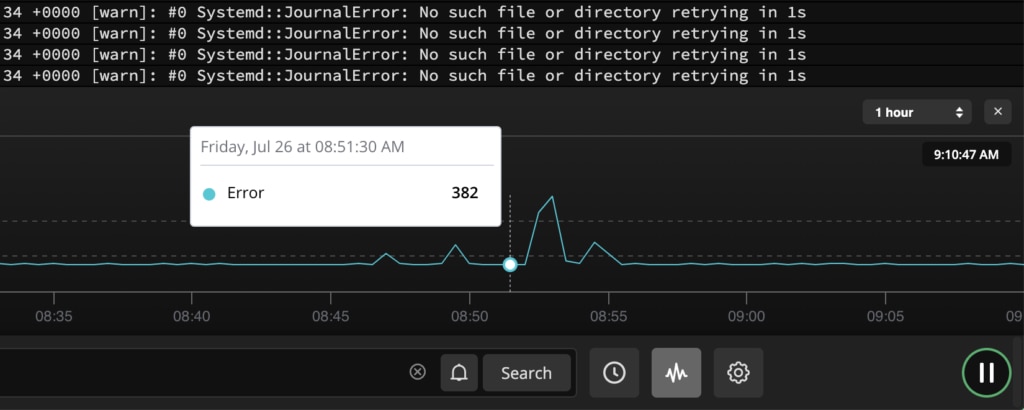
Velocity graphs help identify patterns or anomalies, reducing the time needed to spot trends or troubleshoot errors. They can also be used to seek to a particular time by clicking a point on the line.
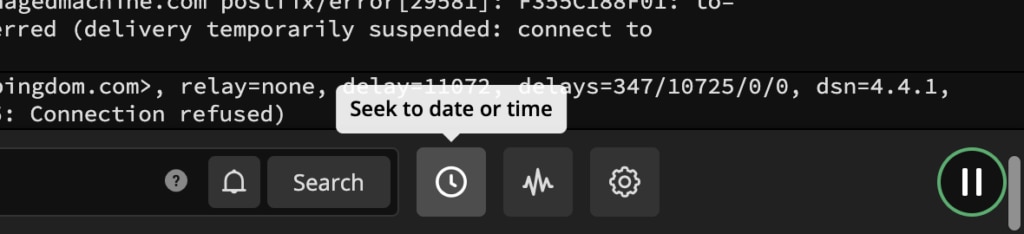
Time seek
To seek directly to any date or time in the searchable history, click the clock icon:
The time seek will expand:
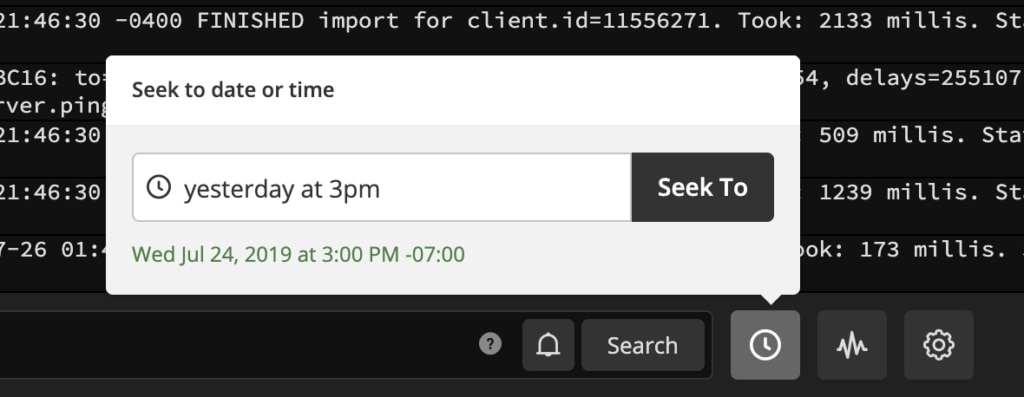
Enter the desired point and click Seek To. When you enter a time, the time zone in your Papertrail profile is used.
Read more about time zones in distributed environments here or here.
Note: Seeking across a DST boundary will jump to a position that is off by 1 hour (details).
Context
Find a message that could use some background? There are four quick ways to put events in context.
Host or program
Hosts and programs are highlighted with different colors and clickable to allow you to see the event in that context:
The log sender link will show that message in context of all messages from that sender (for example, to see a complete error that occurred on a single system).
The log type link will show that message in context of messages from that program (process) in the current group.
After clicking, you’ll be looking at the same log message and any search query will be retained.
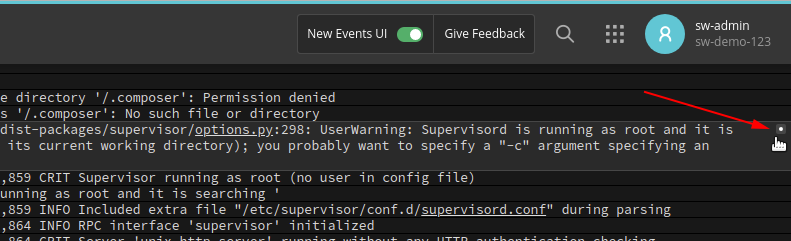
Event actions
To open the event actions menu, click on the 3-dot icon on the left.
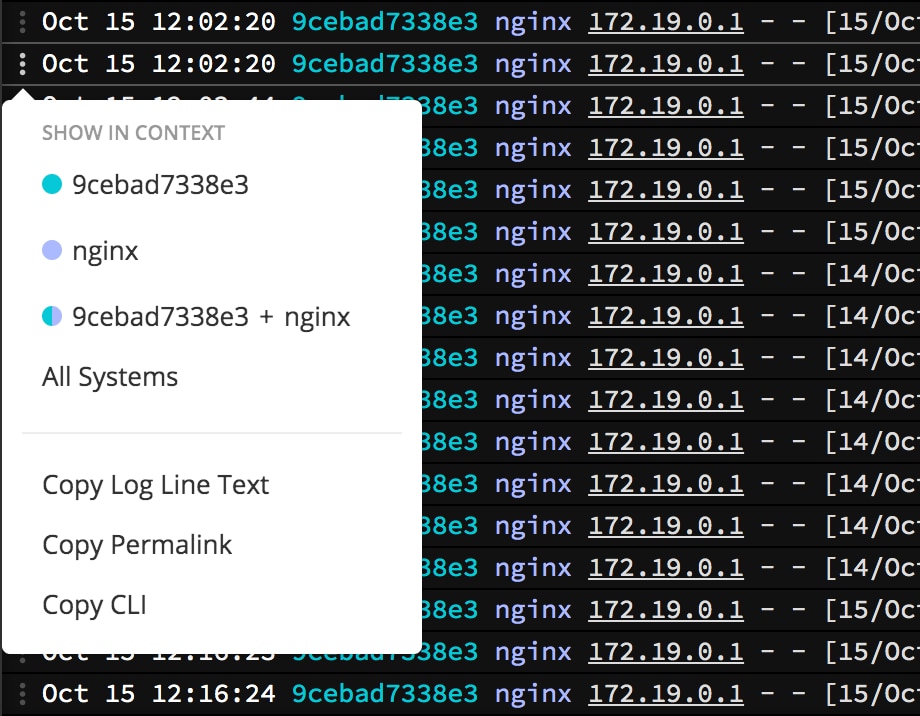
This menu exposes actions to:
- copy this event’s log line text
- link to this event, in the same context you’re viewing
- show this event in the command-line interface
- show this event within events from a system, program, system & program, or group
Event selection
While holding Shift, hover over an event and click on the dot to the right of the event to start a selection. A range can be selected by continuing to hold Shift and clicking a selection dot above or below an existing selected event.
When there is an active selection, the event viewer URL will update to reflect which events are selected, so that the URL can be shared.
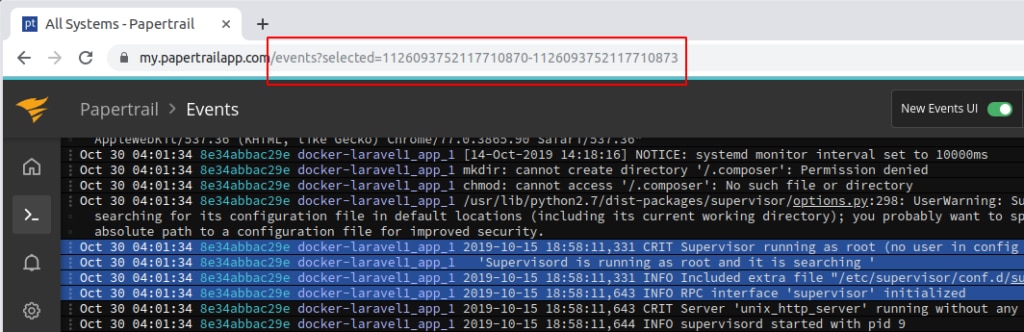
Press Esc to clear a selection.
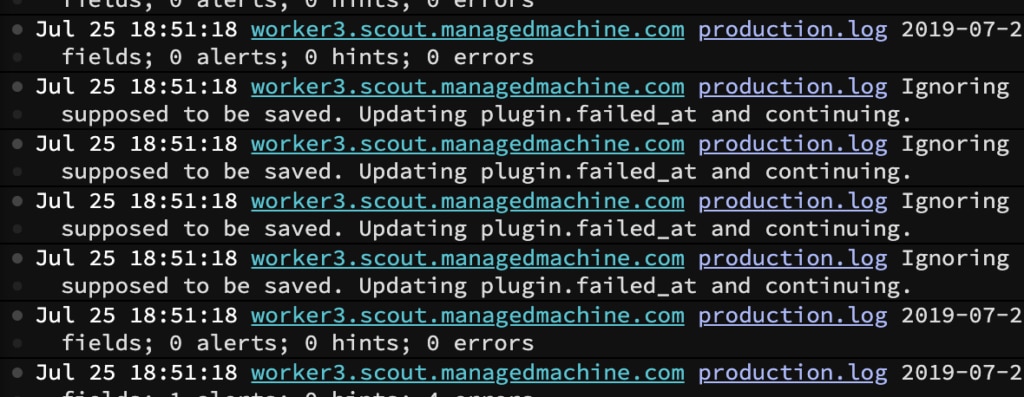
Click-to-search
You can turn pieces of your log messages into clickable elements. When these are clicked, the event viewer will display all surrounding messages that match the clicked element. This could be an IP, email address, user ID, request ID, domain name, source code filename, or any other part of a log message—you get to decide.
Learn more about how this works →
Navigation
Keyboard shortcuts
Press ? while in the log viewer and all will be revealed.
Multiple companies
You may have access to multiple Papertrail entities representing different companies’ logs. Within the log viewer, switch entities at will. See Managing logs from multiple companies.
Customization
Display Preferences
To change your display preferences click on the settings cog. Papertrail provides a multitude of customization options:
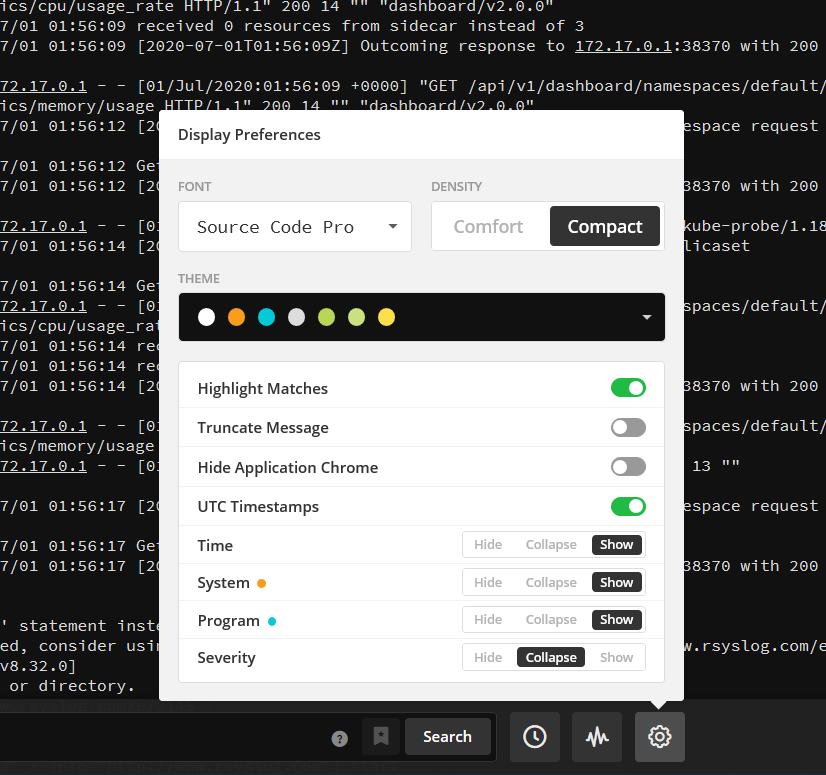
You can control the density of the logs in the viewer by changing the Font and the line Density.
The Theme option allows you to choose from a number of different color schemes including dark and light themes.
Use Truncate Message to display each message on one line only. This is great for aligning messages to view patterns. Click on a line to expand it.
Use the other options to hide parts of the log message that aren’t necessary; for example, Papertrail timestamps (Hide Time) if messages have internal timestamps. Similarly you can Hide System and/or Hide Program to put even more focus on the log message.
If you want to use the full width and height of your screen to see logs you can use Hide Application Chrome.
Use the UTC Timestamps to convert your log timestamps to UTC without the need to modify the time zone in your Profile.
Filtering
Seeing noisy logs? Although your systems and apps decide which log messages are sent to Papertrail, Papertrail can optionally filter noise on your behalf. See Log filtering.